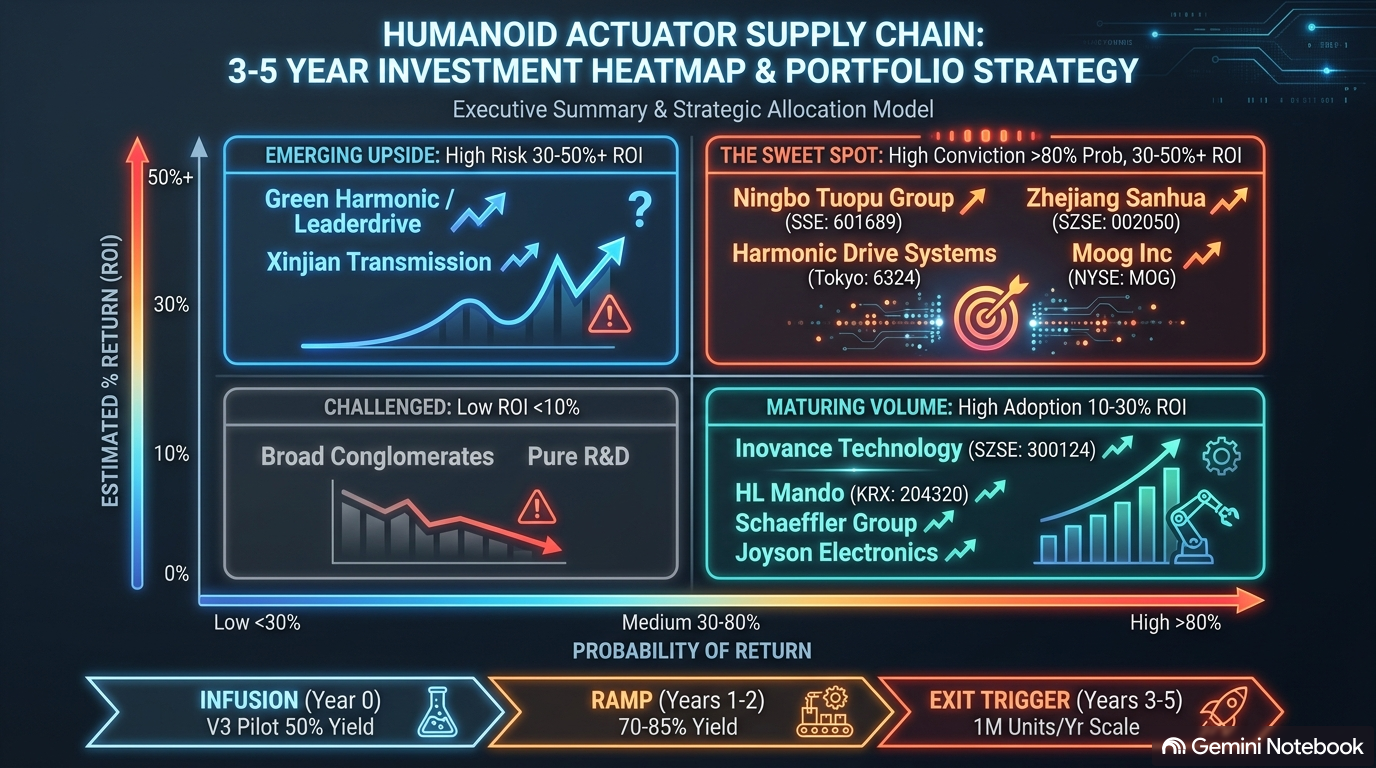
Industry ramp from pilot line to one-million-unit annual scale.
Year 0–5
Target allocation
Portfolio concentration by core supply-chain position.
Capital playbook
Decision gates tied to factory yield and unit economics.
Y0
Infuse 100%Enter during 50% pilot yield while hand and head assemblies remain the binding bottleneck.
Y1–2
Hold and rebalanceTrack 70% to 85% yield progression, delivery billing, and scrap-rate improvement.
Y3
Trim 30–40%Harvest initial gains as output approaches commercial mass scale.
Y4–5
Complete exitExit before component ASP and margins normalize toward automotive Tier-1 economics.
Immediate operating priorities
Next actions implied by the source pack as of September 25, 2026.
01
Convert deep-view investorsPrioritize prospects with more than five minutes of deck engagement.
02
Close custody readinessConfirm Stock Connect, TSE, KRX, NYSE, tax, and multi-currency permissions.
03
Validate model assumptionsRefresh market multiples, FX, yield progression, and ramp timing before capital deployment.
04
Instrument risk triggersMonitor trade controls, rare-earth availability, OEM schedule shifts, and ASP compression.
Illustrative investment dashboard based solely on the supplied 2026 fund pack. It is not investment, legal, tax, or custody advice. Market data and forward-looking assumptions require independent verification before use.
Portfolio & valuation explorer
Filter the target basket and stress-test modeled fund economics.
Company
Role
Allocation
Mkt cap
Fwd P/E
3Y CAGR
Target ROI
Allocation and growth profile
Target weight versus modeled three-year revenue CAGR.
Scenario outputs are simple illustrations, exclude taxes, transaction costs, FX movements, hurdle mechanics, and timing of cash flows, and should not be treated as projected returns.
Factory ramp simulator
Move through the modeled production curve to see yield, throughput, ASP, and TAM implications.
Year 0 · Pilot
Factory yield50%
Daily output50
Actuator set ASP$15,000
Actuator TAM$273.8M
Capital action: Infuse 100%Pilot line bottlenecks create the entry window; suppliers capture revenue on component delivery.
Yield, output, and TAM trajectory
Annual actuator TAM is modeled as daily output × 365 × component-set ASP.
Decision gates
Operating signals that change the portfolio action.
50%
Pilot entryValidate supplier billing and bottleneck persistence.
70%
Ramp proofCheck grinding automation, ECO stability, and scrap reduction.
85%
Harvest setupPrepare staged trims as daily volume accelerates.
95%
Exit disciplineRealize capital before ASP and margins fully normalize.
LP pipeline command center
Fundraising funnel, engagement signals, commitments, and next actions.
Contacts reached3570% of 50-contact targetPortal keys issued2263% of contactedDeep deck views1673% of portal accessInterest / diligence38%Above 25% benchmark
Conversion funnel
Progress from outreach to soft-circle commitment.
Target contacts
50
100%
Contacted
35
70%
Portal access
22
44%
Deep views
16
32%
Active prospects
8
16%
Commitment mix
Current eight-prospect log totals $8.75M of potential commitments.
$8.5M soft-circled
Investor action board
Use status and engagement to prioritize the next conversion step.
Investment committee risk register
Key objections, structural mitigations, and diligence questions from the supplied IC materials.
Risk and mitigation library
Select a risk to expand the committee challenge and response.
Several claims in the source pack are forward-looking or attributed to third-party materials. The dashboard preserves those assumptions for analysis but does not independently validate them.
What it is and how it works
A practical guide to the strategy, the dashboard, and the source artifacts.
What this fund is
Humanoid Robotics Actuator Seed Fund · 2026 target vintage
Cross-platform hardware strategy
This strategy invests in the specialized hardware bottlenecks required to scale humanoid robots—linear and rotary actuators, precision reducers, servo drives, and related motion-control components—rather than taking concentrated exposure to a single robot OEM.
The target basket combines established Tier-1 suppliers across China, Korea, Japan, and the United States. The thesis is that suppliers can benefit as multiple humanoid platforms move from pilot lines to commercial production, while their existing automotive, industrial, or defense businesses provide a downside backstop.
Core thesisMonetize the factory bottleneck: enter during pilot yield constraints, hold through production ramp, harvest as volume reaches scale, and exit before actuator ASPs normalize toward automotive economics.
How the dashboard works
Everything is embedded in this single HTML file.
01
OverviewExecutive KPIs, production ramp, allocation, and immediate operating priorities.
02
PortfolioSearch and filter positions, export the basket to CSV, and test fund-size, ROI, and fee assumptions.
03
Factory rampMove across Years 0–5 to see yield, daily output, ASP, TAM, and capital action gates.
04
LP pipelineReview funnel conversion, soft-circle mix, and investor next actions.
05
IC risksExpand each challenge to see the structural mitigation and diligence focus.
Fund-pack artifacts
Download the supporting materials used to assemble this dashboard.
Source pack · September 2026
Artifact
Format
What it contains
Use it for
Download
Executive overview
PPTX
Five-slide investment committee narrative covering thesis, allocation, ramp, and custody.
The artifacts preserve the supplied fund-pack content. Several assumptions are forward-looking and should be independently verified before distribution, investment decisions, or regulatory use.